checkpointing: Stan
chkpt_stan.RmdThe following examples walk through using chkptstanr with the Stan
The basic idea is to (1) write a custom Stan model
(done by the user), (2) fit the model with cmdstanr (with
the desired number of checkpoints), and then (3) return a
cmststanr object. All but step (1) is done internally, so
the workflow is very similar to using cmdstanr.
Example 1: Eight Schools
Storage
The initial overhead is to create a folder that will store the checkpoints, i.e.,
path <- create_folder(folder_name = "chkpt_folder_m1")Stan Model
Next is the Stan model:
stan_code <- "
data {
 int<lower=0> n;
  real y[n];
  real<lower=0> sigma[n];
}
parameters {
  real mu;
  real<lower=0> tau;
  vector[n] eta;
}
transformed parameters {
  vector[n] theta;
  theta = mu + tau * eta;
}
model {
  target += normal_lpdf(eta | 0, 1);
  target += normal_lpdf(y | theta, sigma);
}
"
Stan Data
When using chkpt_stan(), this requires supplying a list
to the data argument, much like using rstan.
Model Fitting
2 Checkpoints
To show the basic idea of checkpointing, the following was stopped after 2 checkpoints.
fit_m1 <- chkpt_stan(model_code = stan_code,
                   data = stan_data,
                   iter_warmup = 1000,
                   iter_sampling = 1000,
                   iter_per_chkpt = 250,
                   path = path)

#> Compiling Stan program...
#> Initial Warmup (Typical Set)
#> Chkpt: 1 / 8; Iteration: 250 / 2000 (warmup)
#> Chkpt: 2 / 8; Iteration: 500 / 2000 (warmup)
Finish Sampling
To finish the remaining 6 checkpoints run the same code, i.e.,
fit_m1 <- chkpt_stan(model_code = stan_code,
                   data = stan_data,
                   iter_warmup = 1000,
                   iter_sampling = 1000,
                   iter_per_chkpt = 250,
                   path = path)

#> Sampling next checkpoint
#> Chkpt: 3 / 8; Iteration: 750 / 2000 (warmup)
#> Chkpt: 4 / 8; Iteration: 1000 / 2000 (warmup)
#> Chkpt: 5 / 8; Iteration: 1250 / 2000 (sample)
#> Chkpt: 6 / 8; Iteration: 1500 / 2000 (sample)
#> Chkpt: 7 / 8; Iteration: 1750 / 2000 (sample)
#> Chkpt: 8 / 8; Iteration: 2000 / 2000 (sample)
#> Checkpointing complete
Combine Draws
Each checkpoint contains 250 draws from the posterior. These need to
be combined with combine_chkpt_draws(), i.e.,
draws <- combine_chkpt_draws(fit_m1)We developed chkptstanr to work seamlessly with the
Stan ecosystem. The object draws has been
constructed to mimic what is provided when using
cmdstanr directly.
combine_chkpt_draws(fit_m1)

#> # A draws_array: 1000 iterations, 2 chains, and 19 variables
#> , , variable = lp__
#>
#>          chain
#> iteration   1   2
#>         1 -34 -43
#>         2 -37 -41
#>         3 -36 -39
#>         4 -38 -38
#>         5 -38 -41
#>
#> , , variable = mu
#>
#>          chain
#> iteration    1    2
#>         1  5.2  2.6
#>         2 11.3  6.7
#>         3 -2.7  5.3
#>         4 -2.9  3.7
#>         5 -2.7 14.2
#>
#> , , variable = tau
#>
#>          chain
#> iteration    1     2
#>         1 23.3  2.61
#>         2  6.7  0.21
#>         3 12.7  4.44
#>         4 21.1  7.29
#>         5 18.8 10.94
#>
#> , , variable = eta[1]
#>
#>          chain
#> iteration     1     2
#>         1  0.10 -0.61
#>         2  0.89 -0.87
#>         3  1.62  0.83
#>         4  1.99  0.84
#>         5 -0.16  1.22
#>
#> # ... with 995 more iterations, and 15 more variables
Summary
draws can then be used with the R package
posterior
posterior::summarise_draws(draws)

#> # A tibble: 19 x 10
#>    variable      mean     median    sd   mad      q5    q95  rhat ess_bulk ess_tail
#>    <chr>        <dbl>      <dbl> <dbl> <dbl>   <dbl>  <dbl> <dbl>    <dbl>    <dbl>
#>  1 lp__     -39.5     -39.2      2.59  2.58  -44.2   -35.9   1.00     640.    1008.
#>  2 mu         7.77      7.92     5.48  5.10   -1.43   16.0   1.01     530.     325.
#>  3 tau        6.82      5.32     5.75  4.71    0.434  18.7   1.00     649.     658.
#>  4 eta[1]     0.383     0.413    0.929 0.909  -1.20    1.87  1.00    1650.    1233.
#>  5 eta[2]    -0.00335  -0.00816  0.841 0.814  -1.34    1.40  1.00    1443.    1307.
#>  6 eta[3]    -0.176    -0.174    0.931 0.906  -1.67    1.42  1.00    1829.    1424.
#>  7 eta[4]    -0.00521   0.000856 0.862 0.841  -1.47    1.39  1.00    1565.    1407.
#>  8 eta[5]    -0.312    -0.350    0.873 0.835  -1.72    1.24  1.00    1661.    1616.
#>  9 eta[6]    -0.193    -0.190    0.889 0.909  -1.59    1.28  1.00    1915.    1404.
#> 10 eta[7]     0.387     0.358    0.876 0.864  -1.09    1.81  1.00    1574.    1370.
#> 11 eta[8]     0.0805    0.0611   0.970 0.960  -1.51    1.66  1.00    1031.    1236.
#> 12 theta[1]  11.5      10.2      8.29  6.99    0.268  26.4   1.00    1042.     728.
#> 13 theta[2]   7.87      7.87     6.20  5.66   -2.27   17.8   1.00    1549.    1515.
#> 14 theta[3]   6.01      6.63     8.25  6.63   -8.69   18.1   1.00    1102.    1075.
#> 15 theta[4]   7.75      7.76     6.65  5.96   -3.06   18.9   1.00    1674.    1210.
#> 16 theta[5]   5.05      5.70     6.44  5.75   -7.06   14.4   1.00    1405.    1416.
#> 17 theta[6]   6.21      6.60     6.92  6.15   -5.98   16.9   1.00    1890.    1195.
#> 18 theta[7]  10.8      10.1      6.71  6.03    0.992  23.1   1.00    1497.    1767.
#> 19 theta[8]   8.35      8.41     7.72  6.66   -3.88   20.7   1.00    1081.    1075.
Visualization with bayesplot
The popular R package bayesplot can
also be used.
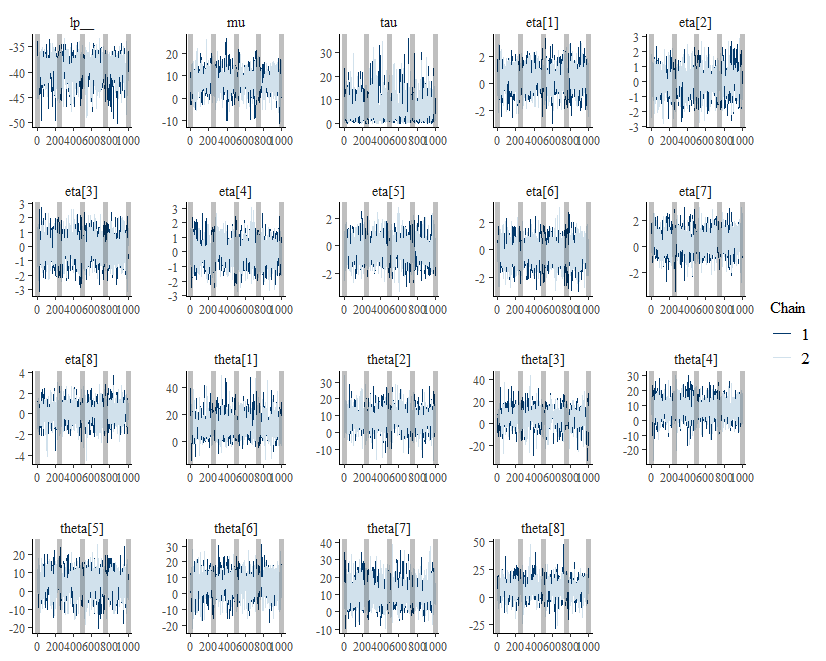
bayesplot::mcmc_trace(draws) +
geom_vline(xintercept = seq(0, 1000, 250),
           alpha = 0.25,
           size = 2)
This vertical lines are placed at each checkpoint.