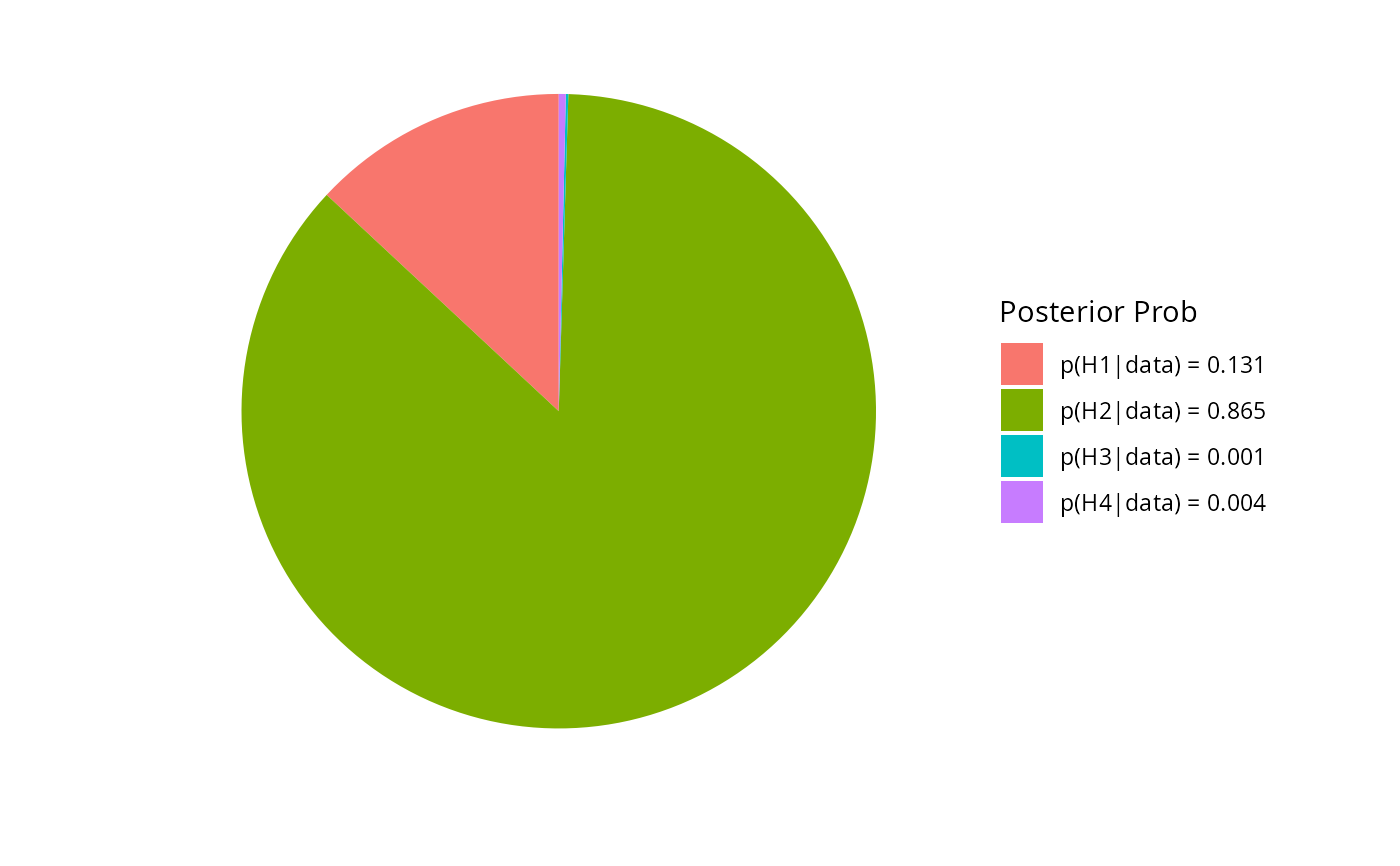
Plot the posterior hypothesis probabilities as a pie chart, with each slice corresponding the probability of a given hypothesis.
Usage
# S3 method for class 'confirm'
plot(x, ...)Examples
# \donttest{

#####################################
##### example 1: many relations #####
#####################################

# data
Y <- bfi

hypothesis <- c("g1_A1--A2 > g2_A1--A2 & g1_A1--A3 = g2_A1--A3;
                 g1_A1--A2 = g2_A1--A2 & g1_A1--A3 = g2_A1--A3;
                 g1_A1--A2 = g2_A1--A2 = g1_A1--A3 = g2_A1--A3")

Ymale   <- subset(Y, gender == 1,
                  select = -c(education,
                              gender))[,1:5]


# females
Yfemale <- subset(Y, gender == 2,
                     select = -c(education,
                                 gender))[,1:5]

test <- ggm_compare_confirm(Ymale,
                            Yfemale,
                            hypothesis = hypothesis,
                            iter = 250,
                            progress = FALSE)


# plot
plot(test)

# }
# }
