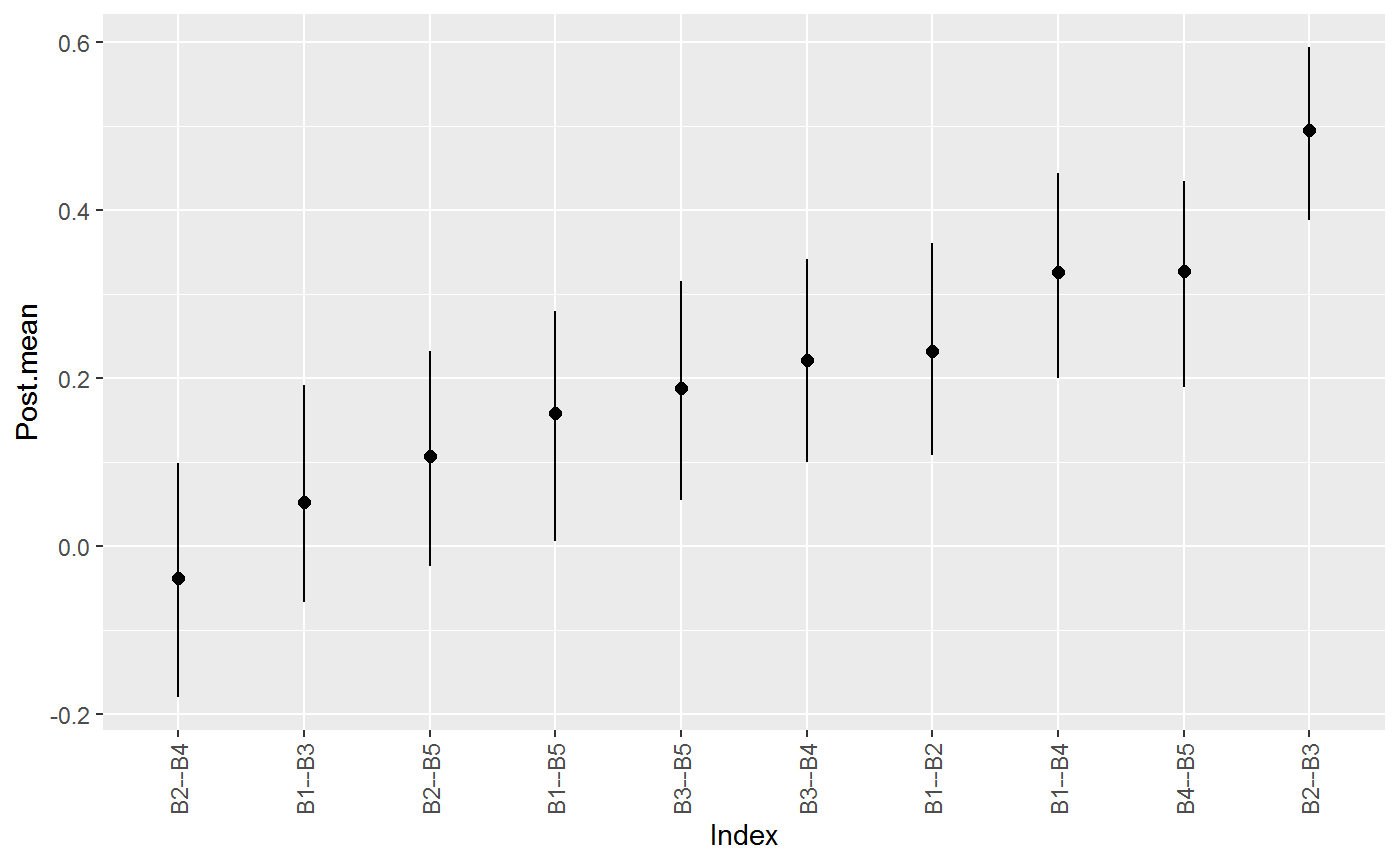
Visualize the posterior distributions for each partial correlation.
Usage
# S3 method for class 'summary.estimate'
plot(x, color = "black", size = 2, width = 0, ...)Visualize the posterior distributions for each partial correlation.
# S3 method for class 'summary.estimate'
plot(x, color = "black", size = 2, width = 0, ...)