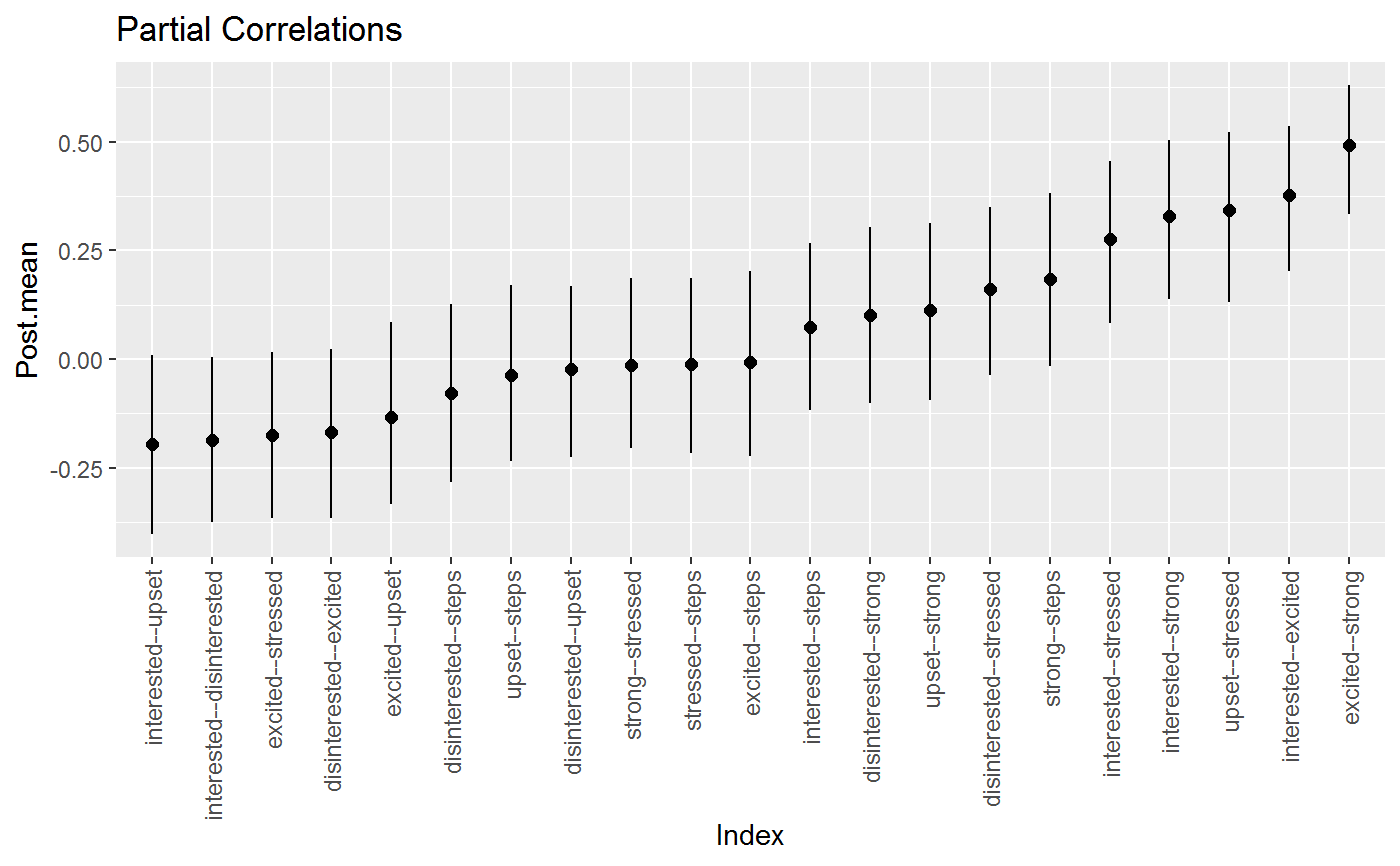
Visualize the posterior distributions of each partial correlation and regression coefficient.
Usage
# S3 method for class 'summary.var_estimate'
plot(x, color = "black", size = 2, width = 0, param = "all", order = TRUE, ...)
Arguments
- x
An object of class
summary.var_estimate- color
Character string. The color for the error bars. (defaults to
"black").- size
Numeric. The size for the points (defaults to
2).- width
Numeric. The width of error bar ends (defaults to
0).- param
Character string. Which parameters should be plotted ? The options are
pcor,beta, orall(default).- order
Logical. Should the relations be ordered by size (defaults to
TRUE) ?- ...
Currently ignored
Examples
# \donttest{

# data
Y <- subset(ifit, id == 1)[,-1]

# fit model with alias (var_estimate also works)
fit <- var_estimate(Y, progress = FALSE)

plts <- plot(summary(fit))
plts$pcor_plt

# }
# }
