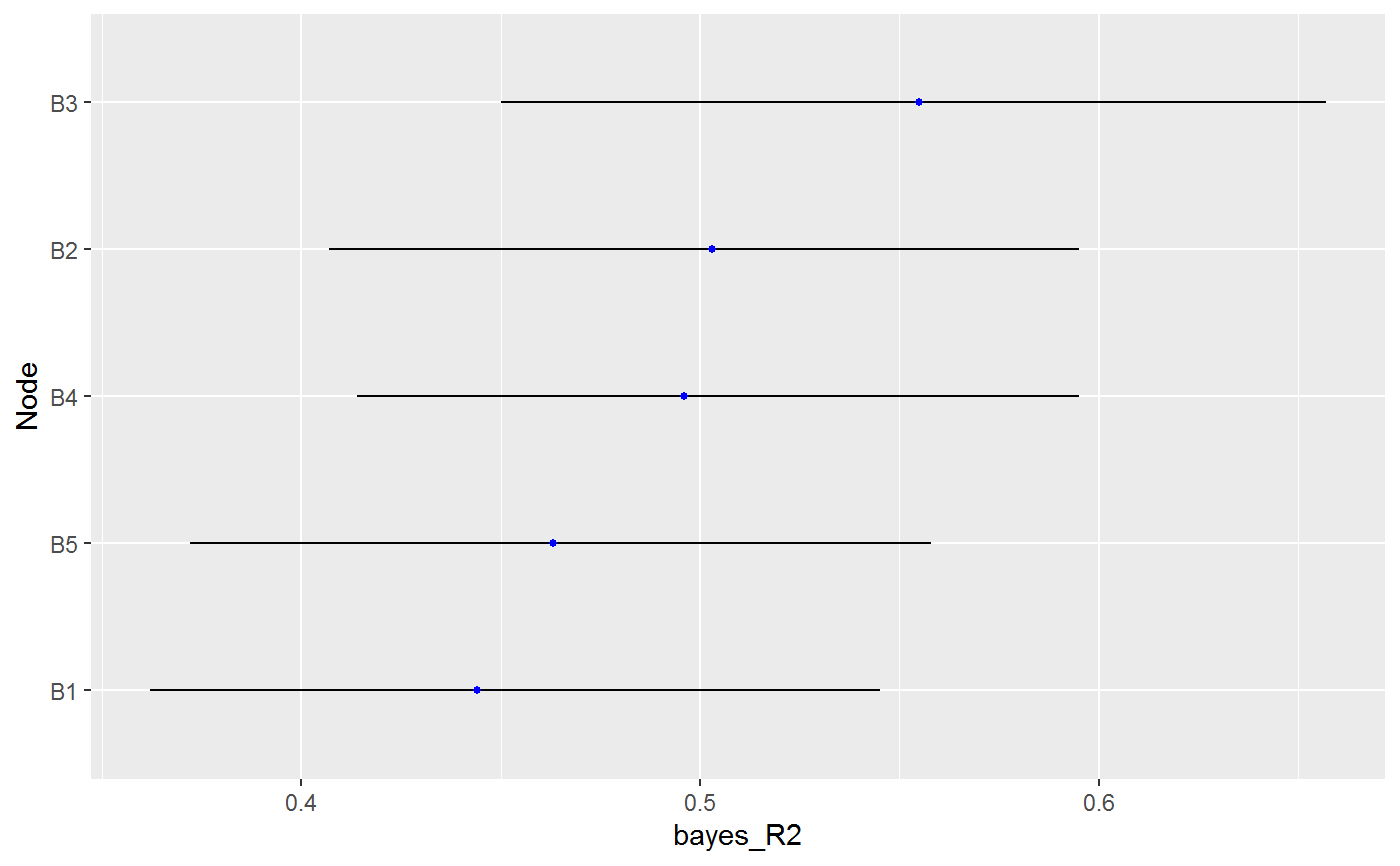
Plot predictability Objects
Usage
# S3 method for class 'predictability'
plot(
  x,
  type = "error_bar",
  cred = 0.95,
  alpha = 0.5,
  scale = 1,
  width = 0,
  size = 1,
  color = "blue",
  ...
)
Arguments
- x
An object of class
predictability- type
Character string. Which type of plot ? The options are
"error_bar"or"ridgeline"(defaults to"error_bar").- cred
Numeric. The credible interval width for summarizing the posterior distributions (defaults to 0.95; must be between 0 and 1).
- alpha
Numeric. Transparancey of the ridges
- scale
Numeric. This controls the overlap of densities for
type = "ridgeline"(defaults to 1).- width
Numeric. The width of error bar ends (defaults to
0) fortype = "error_bar".- size
Numeric. The size for the points (defaults to
2) fortype = "error_bar".- color
Character string. What color for the point (
type = "error_bar") or tail region (type = "ridgeline") ? Defaults to"blue".- ...
Currently ignored.
Examples
# \donttest{
Y <- ptsd[,1:5]

fit <- explore(Y, iter = 250,
               progress = FALSE)

r2 <- predictability(fit, iter = 250,
                     progress = FALSE)

plot(r2)


# }
# }